Grow your own way: Introducing native support for custom metrics in GKE
When platform engineers, AI Infrastructure leads and developers think about autoscaling workloads running on Kubernetes, their goal is straightforward: get the capacity they need, when they need it, at the best price.
However, while scaling on CPU and memory is simple enough, scaling on application signals like queue depth or active requests is not. Historically, it’s been achieved via a complex sequence of different steps involving monitoring, IAM and specific agent configuration, adding significant operational overhead.
Today, we are removing that friction, with native support for custom metrics for the Horizontal Pod Autoscaler (HPA) running on Google Kubernetes Engine (GKE). This is a new feature that elevates custom workload signals to a native GKE capability.
The current challenge: The custom metric "tax"
If you’ve ever tried to scale a workload based on custom metrics (like active requests, KV Cache or a game server player count), you know this architecture is surprisingly heavy. You don’t just write a few lines of YAML, you need to glue together multiple disparate systems.
Today, to make Horizontal Pod Autoscaler scale on custom metrics, you have to configure multiple components:
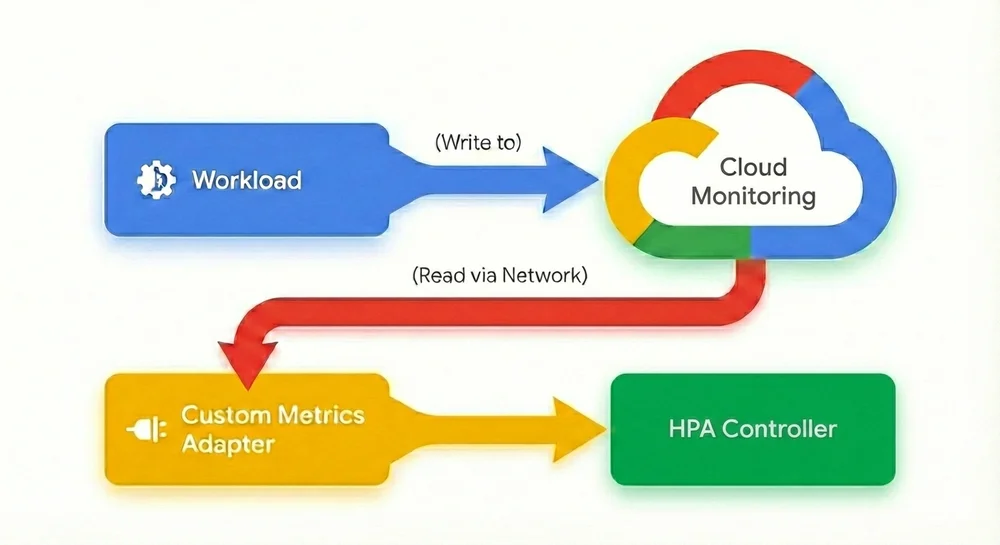
1. Export the metric: First, configure your Pod to send (export) its metrics either to Cloud Monitoring, Google Managed Prometheus or whatever monitoring system you use.
2. Configure the “middleman”: Then, install and manage either the custom-metrics-stackdriver-adapter or prometheus-adapter in your cluster to act as a translator between Cloud Monitoring and the HPA. Configuring these adapters isn’t always straightforward, and maintaining them can be complex and error-prone.
3. Navigate the IAM labyrinth: This is often the biggest hurdle. To allow the adapter to read the metrics you just exported, you must:
◦ Enable Workload Identity Federation on your cluster.
◦ Create a Google Cloud IAM Service Account.
◦ Create a Kubernetes Service Account and annotate it.
◦ Bind the two accounts together using an IAM policy binding.
◦ Grant specific IAM roles.
4. Manage operational risk: Once configured, your autoscaling logic now depends on your observability stack being available. If metric ingestion lags or the adapter fails, your scaling breaks.
In other words, all of a sudden your production environment hinges on your monitoring. While monitoring systems are part of your critical infrastructure and an important part of the production environment, production can generally continue even if they fail. In this configuration though, the autoscaling mechanism is now dependent on your monitoring system. If the monitoring system readout or the system itself fails, the workload can’t autoscale anymore. This creates an inherent operational risk, where scaling logic is coupled to the availability of an external observability stack. According to most IT best practices, this kind of circular dependency is not a recommended configuration, as it complicates troubleshooting and reduces a service’s overall resilience.
Furthermore, Kubernetes users often adopt third-party solutions because configuring HPA to scale on custom metrics has historically been so clunky, cumbersome, and error-prone. Managing and syncing third-party solutions and their complex setups can be difficult to align with GKE updates or upgrade cycles.
Agentless, native autoscaling
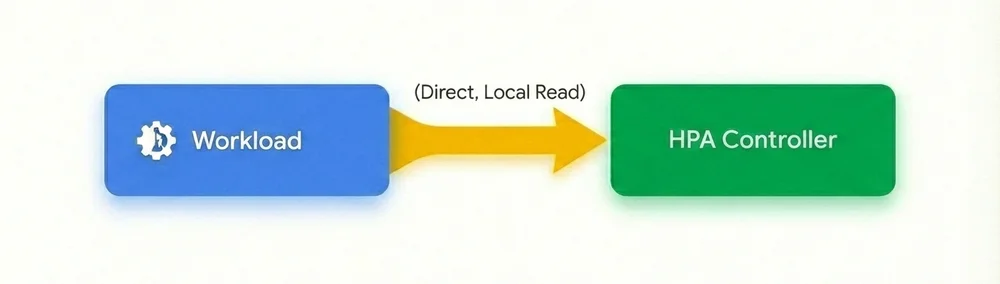
With native support for custom metrics in GKE, we’ve removed the middleman and fundamentally redesigned the autoscaling flow. Scaling workloads on real-time custom metrics is now as simple as scaling on memory or CPU, with no complex and circular dependencies on monitoring systems, adapters, service accounts, or IAM roles.
No agents, no adapters, no complex IAM: Custom metrics are now directly sourced from your Pods and delivered to the HPA. With this agentless architecture, you no longer need to maintain a custom metrics adapter or manage complex Workload Identity bindings.
Native support for custom metrics:
For organizations running demanding workloads including AI inference, financial services, retail, gaming, etc. this update is a game changer:
-
No more middleman: Remove the complexity of adapters, sidecars, and IAM role bindings. If your application exposes the metric, GKE can scale on it.
-
Reduced latency: By eliminating the round trip to an external monitoring system, the HPA reacts much faster. This is critical for preventing demanding services from degrading during sudden traffic bursts.
-
Cost efficiency: No more paying ingestion costs for metrics that are solely used for autoscaling decisions. A more precise and faster response to scaling events also helps save on compute resources.
-
Improved reliability: Your scaling logic no longer depends on the uptime of your external observability stack; it is self-contained within the cluster.
To simplify gathering metrics, a new controller lets you easily configure which metrics HPA should scale on:
- code_block
- <ListValue: [StructValue([('code', 'apiVersion: autoscaling.gke.io/v1beta1\r\nkind: AutoscalingMetric\r\nmetadata:\r\n name: vllm-autoscaling-metric\r\n namespace: autoscaling-metrics\r\nspec:\r\n metrics:\r\n - pod:\r\n selector:\r\n matchLabels:\r\n app: vllm-metrics\r\n containers:\r\n - endpoint:\r\n port: metrics\r\n path: /metrics\r\n metrics:\r\n - gauge:\r\n name: kv_cache_usage_perc\r\n prometheusMetricName: vllm:kv_cache_usage_perc\r\n filter:\r\n matchLabels:\r\n label: v1'), ('language', ''), ('caption', <wagtail.rich_text.RichText object at 0x7f27c0ba91f0>)])]>
Once this configuration is created, all you need to do is to set HPA to the metric you just defined via the AutoscalingMetric controller:
- code_block
- <ListValue: [StructValue([('code', 'apiVersion: autoscaling/v2\r\nkind: HorizontalPodAutoscaler\r\n...\r\nmetrics:\r\n - type: Pods\r\n pods:\r\n metric:\r\n name: autoscaling.gke.io|vllm-autoscaling-metric|kv_cache_usage_perc'), ('language', ''), ('caption', <wagtail.rich_text.RichText object at 0x7f27c0ba94f0>)])]>
And that’s it! GKE’s native custom metrics support lets you pick a gauge metric from any workload and use it as a trigger value in HPA. These two simple steps replace the entire process that we described above for setting this up.
Try it out today!
Native support for custom metrics in GKE is just the first step in our journey toward intent-based autoscaling, which allows you to simply define the required performance for your workload similar to how SLOs are defined today. Whether you’re optimizing GPU utilization for LLMs, managing bursty batch jobs, running highly scaling agentic workloads or any other mission critical service, GKE now allows you to simply and efficiently express your scaling strategy based on actual workload metrics, rather than using CPU or Memory resource metrics. To get started with native custom metrics, check out the documentation.
You Might Also Like

The Home Computer War
